If you want to monitor the temperature of your cpu while running some intensive application you can plot the graph and see it in realtime. This is often done to benchmark the efficiency of the cooling system and the thermal performance of the cpu.
In this article we take a quick look at some tools that can be used to plot a graph of the cpu temperature. Along with the temperature, we can also plot other parameters like clock frequency, load and power consumption.
The hardware components like cpu, gpu all have built-in sensors that track various parameters like temperature and power consumption. Applications query these sensors through software functions and report the value to the user.
To stress the cpu I have used Cinebench, which causes the average load to go upto 100% and then we monitor various different graphs.
1. Open Hardware Monitor
Open Hardware Monitor is a free tool that can query a lot of different kind of sensors and fetch the information for user analysis. This includes cpu metrics, gpu metrics, memory usage and disk usage. It works with both intel and amd cpus and on the gpu side supports nvidia very well. On my 5800H cpu it could not show metrics of the amd radeon integrated gpu.
Plot Graph: Launch the application and click on View > Show Plot, and it will show graph plots on the right side. The time is on the x axis and the duration length depicted can be adjusted.
Now on the left panel click in the checkbox for the metrics that you wish to monitor on the graph.
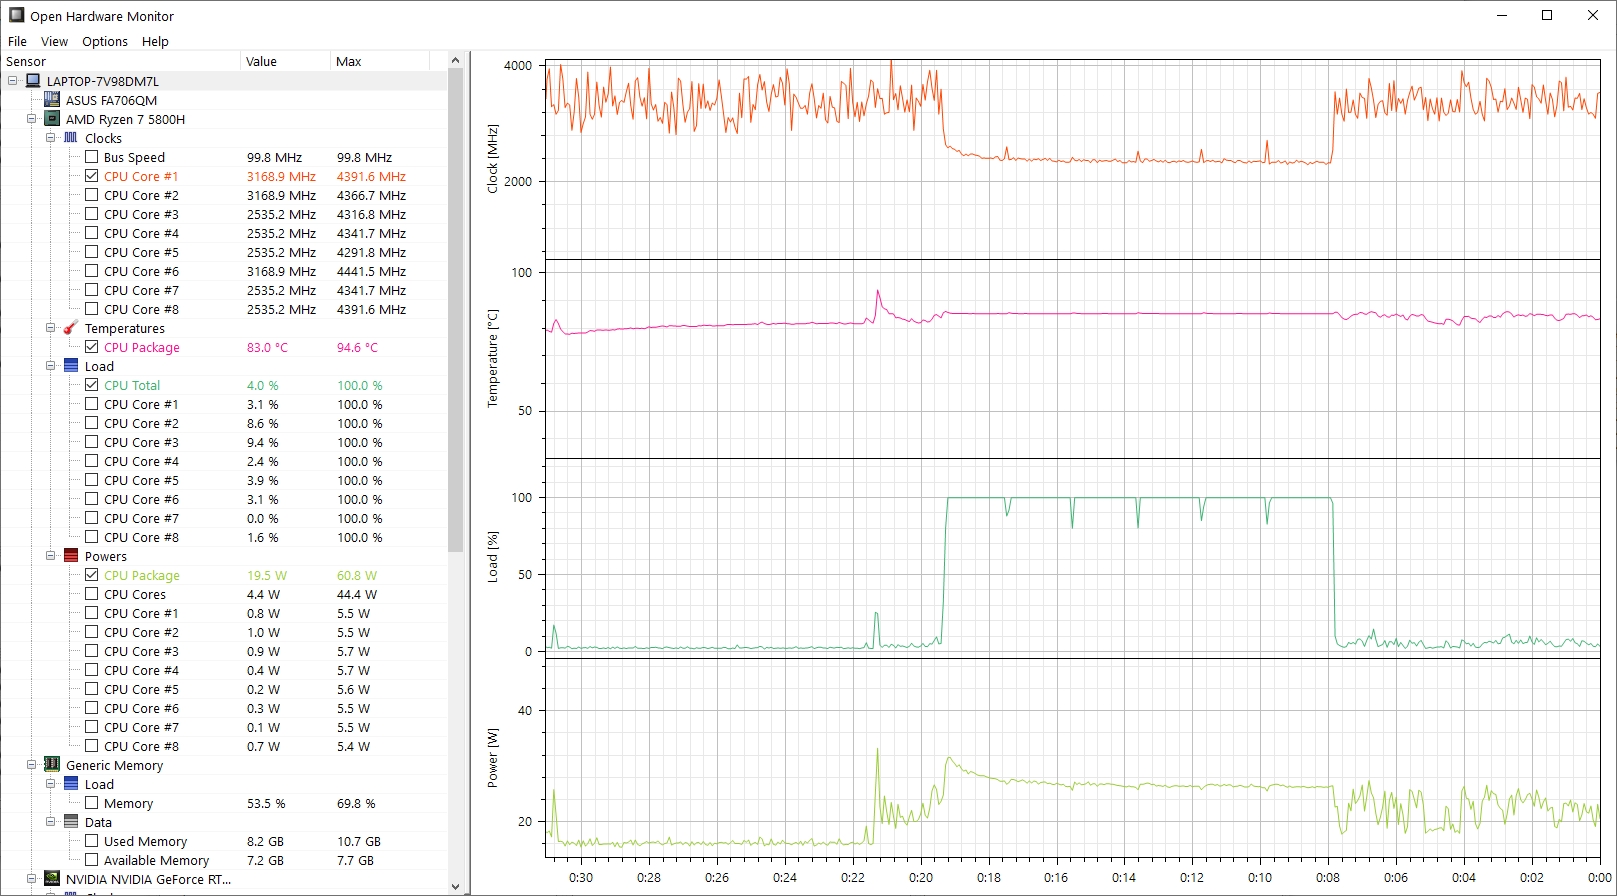
Open Hardware Monitor CPU Temperature Graph
In the screenshot, we can see that open hardware monitor is rendering the graphs for all cpu parameters in realtime, including
- Clock Frequency
- Temperature
- Average load
- Power consumption
Note the correlation between the cpu metrics. As the load rises, the power consumption and temperature also rises. However, as the temperatures touch peak, the clock frequency immediately throttles down to bring temperatures down to safe range, which causes the power consumption to come down as well
This is why it is recommended to have good cooling system, so that the cpu temperatures don't cross the limit to trigger throttling of clock frequency.
Furthermore if under load the temperature peak levels are very high followed by very low clock frequency for throttling, this could indicate problems with the cooling system that need to be address immediately.
2. Hwinfo
The next tool that can show cpu temperature graphs is the commonly used Hwinfo. It shows a lot of details about the hardware as well as can plot graphs of dynamic metrics.
Click Monitoring > Sensor status. It will open the "Sensors status" window. Now right click any metric and click "Show Graph". In this example I shall plot the following metrics:
- Core Clocks - The overall Clock Frequency
- CPU Core - The overall temperature
- CPU Package Power - The total power consumption
- Total CPU Usage - The average load
Here is how it looks with all the graph plots.

HWiNFO Monitor CPU Temperature Graph
In the above graphs we can see that when the load touches peak levels, the clock and power consumption start throttling to bring the temperature down. If the cooling is made more powerful, the system can sustain high clock frequencies thereby delivering higher cpu performance. Efficient cooling matters a lot when it comes to cpu performance.
Testing Thermal Stability
If you want to test the thermal stability of your system you can perform a simple test, by running a cpu heavy application and then monitoring the graph. Depending on whether you are using an air cooler or an aio liquid cooler, the thermal performance can vary greatly.
Air Cooler reach thermal equilibrium must faster (almost instantly) since its just metal and air based cooling. However liquid coolers will initially absorb a lot of heat letting the cpu maintain high frequency during load, but after some time (usually a few minutes) as the liquid heats up and it approaches thermal equilibrium, the heat absorption rate would drop and settle to a lower value than before. This will cause temperatures to rise and frequencies to drop.
This is a pretty well known and understood phenomena of liquid cooling when compared with air cooling. Liquid coolers can maintain excellent thermals for a short duration initially but eventually start to slow down in their heat dissipation capacity because of the liquid and then temperatures get stable at higher levels.
However, liquid cooling come in various shapes and sizes. The larger ones with more liquid and larger radiators can handle more heat and outperform the air coolers.
Conclusion
Ideally, the cpu temperature should not exceed 95-100 C. Most laptops for instance are configured in a way that the cpu clocks automatically drops the moment the temperatures exceed a certain threshold. This is because laptops have less efficient cooling compared to desktops due to size constraints and dropping the cpu clock is the only way to lower the heat.
Similar to the cpu, the performance of the gpu (graphics "processor") also depends on the temperature and cooling. Both the above tools can plot the gpu temperature and power consumption as well.