ss - socket statistics
In a previous tutorial we saw how to use the netstat command to get details about the network/socket connections. However the netstat command has long been deprecated and replaced by the ss command from the iproute suite of tools.
The ss command is capable of showing details about network connections with more information than the netstat command and it is faster. The netstat command reads various /proc files to gather information. However this approach is slower when there are lots of connections to display.
The ss command gets its information directly from kernel space. The options used with the ss commands are very similar to netstat making it an easy replacement.
So in this tutorial we are going to see few examples of how to use the ss command to check the network connections and socket statistics.
1. List all connections
The simplest command is to list out all connections.
$ ss | less
Netid  State      Recv-Q Send-Q   Local Address:Port       Peer Address:Port
u_str  ESTAB      0      0                    * 15545                 * 15544
u_str  ESTAB      0      0                    * 12240                 * 12241
u_str  ESTAB      0      0      @/tmp/dbus-2hQdRvvg49 12726                 * 12159
u_str  ESTAB      0      0                    * 11808                 * 11256
u_str  ESTAB      0      0                    * 15204                 * 15205
.....
We are piping the output to less so that the output is scrollable. The output will contain all tcp, udp and unix socket connection details.
2. Filter out tcp,udp or unix connections
To view only tcp or udp or unix connections use the t, u or x option.
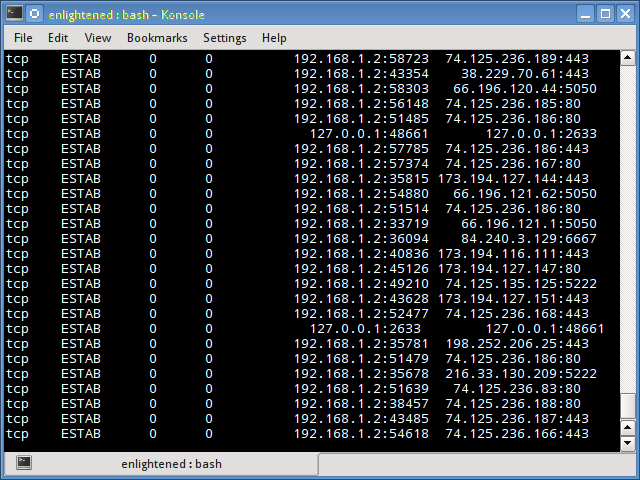
$ ss -t
State      Recv-Q Send-Q    Local Address:Port        Peer Address:Port
ESTAB      0      0           192.168.1.2:43839     108.160.162.37:http
ESTAB      0      0           192.168.1.2:43622     199.59.149.201:https
ESTAB      0      0           192.168.1.2:33141      83.170.73.249:ircd
ESTAB      0      0           192.168.1.2:54028     74.125.135.125:xmpp-client
$ ss -t
OR
$ ss -A tcp
By default the "t" option alone is going to report only those connections that are "established" or CONNECTED". It does not report the tcp sockets that are "LISTENING". Use the '-a' option together with t, to report them all at once.
List all udp connections
$ ss -ua
State      Recv-Q Send-Q    Local Address:Port        Peer Address:Port
UNCONN     0      0           192.168.1.2:48268                  *:*
UNCONN     0      0           192.168.1.2:56575                  *:*
UNCONN     0      0                     *:40309                  *:*
UNCONN     0      0           192.168.1.2:56879                  *:*
UNCONN     0      0                     *:49014                  *:*
UNCONN     0      0           192.168.1.2:53124                  *:*
UNCONN     0      0             127.0.1.1:domain                 *:*
$ ss -a -A udp
The a option tells ss to report both "CONNECTED" and "LISTENING" sockets. Since UDP is a connection-less protocol, just "ss -u" will not report anything in most cases. Therefore we use the "a" option report all UDP connections (connected and listening).
Similarly use the x option to list out all unix socket connections.
3. Do not resolve hostname
To get the output faster, use the "n" option to prevent ss from resolving ip addresses to hostnames. But this will prevent resolution of port numbers as well.
$ ss -nt
State      Recv-Q Send-Q      Local Address:Port        Peer Address:Port
ESTAB      0      0             192.168.1.2:43839     108.160.162.37:80
ESTAB      0      0             192.168.1.2:51350      74.125.200.84:443
ESTAB      0      0             192.168.1.2:33141      83.170.73.249:6667
ESTAB      0      0             192.168.1.2:54028     74.125.135.125:5222
ESTAB      0      0             192.168.1.2:48156      66.196.120.44:5050
4. Show only listening sockets
This will list out all the listening sockets. For example apache web server opens a socket connection on port 80 to listen for incoming connections.
$ ss -ltn
State      Recv-Q Send-Q        Local Address:Port          Peer Address:Port
LISTEN     0      5                 127.0.1.1:53                       *:*
LISTEN     0      128               127.0.0.1:631                      *:*
LISTEN     0      128                     ::1:631                     :::*
The above command lists out all "listening" "tcp" connections. The n option disables hostname resolution of the ip addresses giving the output faster.
To list out all listening udp connections replace t by u
$ ss -lun
State      Recv-Q Send-Q        Local Address:Port          Peer Address:Port
UNCONN     0      0                 127.0.1.1:53                       *:*
UNCONN     0      0                         *:68                       *:*
UNCONN     0      0               192.168.1.2:123                      *:*
UNCONN     0      0                 127.0.0.1:123                      *:*
UNCONN     0      0                         *:123                      *:*
UNCONN     0      0                         *:5353                     *:*
UNCONN     0      0                         *:47799                    *:*
UNCONN     0      0                         *:25322                    *:*
UNCONN     0      0                        :::54310                   :::*
.....
5. Print process name and pid
To print out the process name/pid which owns the connection use the p option
$ ss -ltp
State      Recv-Q Send-Q    Local Address:Port        Peer Address:Port
LISTEN     0      100           127.0.0.1:smtp                   *:*
LISTEN     0      128           127.0.0.1:9050                   *:*
LISTEN     0      128                   *:90                     *:*
LISTEN     0      128                   *:db-lsp                 *:*        users:(("dropbox",3566,32))
LISTEN     0      5             127.0.0.1:6600                   *:*
LISTEN     0      128           127.0.0.1:9000                   *:*        users:(("php5-fpm",1620,0),("php5-fpm",1619,0))
In the above output the last column contains the process name and pid. In this example dnsmasq is the process name and 1299 is the pid.
$ sudo ss -ltp
[sudo] password for enlightened:
State      Recv-Q Send-Q    Local Address:Port        Peer Address:Port
LISTEN     0      100           127.0.0.1:smtp                   *:*        users:(("master",2051,12))
LISTEN     0      128                   *:90                     *:*        users:(("nginx",1701,6),("nginx",1700,6),("nginx",1699,6),("nginx",1697,6),("nginx",1696,6))
LISTEN     0      5             127.0.0.1:6600                   *:*        users:(("mpd",2392,5))
LISTEN     0      128           127.0.0.1:9000                   *:*        users:(("php5-fpm",1620,0),("php5-fpm",1619,0),("php5-fpm",1616,7))
LISTEN     0      16                    *:2633                   *:*        users:(("oned",1853,16))
LISTEN     0      50            127.0.0.1:mysql                  *:*        users:(("mysqld",1095,10))
LISTEN     0      5             127.0.1.1:domain                 *:*        users:(("dnsmasq",1347,5))
LISTEN     0      32                    *:ftp                    *:*        users:(("vsftpd",1051,3))
LISTEN     0      128                   *:ssh                    *:*        users:(("sshd",1015,3))
LISTEN     0      128           127.0.0.1:ipp                    *:*        users:(("cupsd",688,11))
LISTEN     0      128                  :::http                  :::*        users:(("apache2",5322,4),("apache2",5321,4),("apache2",5317,4),("apache2",5316,4),("apache2",5313,4),("apache2",2505,4))
LISTEN     0      128                  :::ssh                   :::*        users:(("sshd",1015,4))
LISTEN     0      128                 ::1:ipp                   :::*        users:(("cupsd",688,10))
6. Print summary statistics
The s option prints out the statistics.
$ ss -s
Total: 526 (kernel 0)
TCP:   10 (estab 7, closed 0, orphaned 0, synrecv 0, timewait 0/0), ports 0

Transport Total     IP        IPv6
*	  0         -         -
RAW	  0         0         0
UDP	  15        9         6
TCP	  10        9         1
INET	  25        18        7
FRAG	  0         0         0
7. Display timer information
With the '-o' option, the time information of each connection would be displayed. The timer information tells how long with
$ ss -tn -o
State      Recv-Q Send-Q      Local Address:Port        Peer Address:Port
ESTAB      0      0             192.168.1.2:43839     108.160.162.37:80
ESTAB      0      0             192.168.1.2:36335     204.144.140.26:80     timer:(keepalive,26sec,0)
ESTAB      0      0             192.168.1.2:33141      83.170.73.249:6667
ESTAB      0      0             192.168.1.2:58857      74.121.141.84:80     timer:(keepalive,23sec,0)
ESTAB      0      0             192.168.1.2:42794     173.194.40.239:80     timer:(keepalive,32sec,0)
8. Display only IPv4 or IPv6 socket connections
To display only IPv4 socket connections use the '-f inet' or '-4' option.
$ ss -tl -f inet
State      Recv-Q Send-Q    Local Address:Port        Peer Address:Port
LISTEN     0      100           127.0.0.1:smtp                   *:*
LISTEN     0      128           127.0.0.1:9050                   *:*
LISTEN     0      128                   *:90                     *:*
LISTEN     0      128                   *:db-lsp                 *:*
LISTEN     0      5             127.0.0.1:6600                   *:*
To display only IPv6 connections use the '-f inet6' or '-6' option.
$ ss -tl6
State      Recv-Q Send-Q    Local Address:Port        Peer Address:Port
LISTEN     0      100                 ::1:smtp                  :::*
LISTEN     0      128                  :::12865                 :::*
LISTEN     0      128                  :::http                  :::*
LISTEN     0      128                  :::ssh                   :::*
LISTEN     0      128                 ::1:ipp                   :::*
9. Filtering connections by tcp state
The ss command supports filters that can be use to display only specific connections. The filter expression should be suffixed after all options. The ss command accepts filter in the following format.
$ ss [ OPTIONS ] [ STATE-FILTER ] [ ADDRESS-FILTER ]
Now here are some examples of how to filter socket connections by socket states.
To display all Ipv4 tcp sockets that are in "connected" state.
$ ss -t4 state established
Recv-Q Send-Q         Local Address:Port             Peer Address:Port
0      0                192.168.1.2:54436          165.193.246.23:https
0      0                192.168.1.2:43386          173.194.72.125:xmpp-client
0      0                192.168.1.2:38355           199.59.150.46:https
0      0                192.168.1.2:56198          108.160.162.37:http
Display sockets with state time-wait
$ ss -t4 state time-wait
Recv-Q Send-Q         Local Address:Port             Peer Address:Port
0      0                192.168.1.2:42261           199.59.150.39:https
0      0                  127.0.0.1:43541               127.0.0.1:2633
The state can be either of the following
- 1. established
- 2. syn-sent
- 3. syn-recv
- 4. fin-wait-1
- 5. fin-wait-2
- 6. time-wait
- 7. closed
- 8. close-wait
- 9. last-ack
- 10. closing
- 11. all - All of the above states
- 12. connected - All the states except for listen and closed
- 13. synchronized - All the connected states except for syn-sent
- 14. bucket - Show states, which are maintained as minisockets, i.e. time-wait and syn-recv.
- 15. big - Opposite to bucket state.
Note that many states like syn-sent, syn-recv would not show any sockets most of the time, since sockets remain in such states for a very short time. It would be ideal to use the watch command to detect such socket states in real time.
Here is an example
$ watch -n 1 "ss -t4 state syn-sent"
After running the above command, try opening some website in a browser or download something from some url. Immediately you should see socket connections appearing in the output, but for a very short while.
Every 1.0s: ss -t4 state syn-sent                   Tue Apr  1 10:07:33 2014

Recv-Q Send-Q           Local Address:Port               Peer Address:Port

0      1                  192.168.1.2:55089            202.79.210.121:https

0      1                  192.168.1.2:33733             203.84.220.80:https

0      1                  192.168.1.2:36240             106.10.198.33:https
10. Filter connections by address and port number
Apart from tcp socket states, the ss command also supports filtering based on address and port number of the socket. The following examples demonstrate that.
Display all socket connections with source or destination port of ssh.
$ ss -at '( dport = :ssh or sport = :ssh )'
State      Recv-Q Send-Q    Local Address:Port        Peer Address:Port
LISTEN     0      128                   *:ssh                    *:*
LISTEN     0      128                  :::ssh                   :::*
Sockets with destination port 443 or 80
$ ss -nt '( dst :443 or dst :80 )'
State      Recv-Q Send-Q      Local Address:Port        Peer Address:Port
ESTAB      0      0             192.168.1.2:58844      199.59.148.82:443
ESTAB      0      0             192.168.1.2:55320     165.193.246.23:443
ESTAB      0      0             192.168.1.2:56198     108.160.162.37:80
ESTAB      0      0             192.168.1.2:54889    192.241.177.148:443
ESTAB      0      0             192.168.1.2:39893      173.255.230.5:80
ESTAB      0      0             192.168.1.2:33440      38.127.167.38:443
The following syntax would also work
$ ss -nt dst :443 or dst :80
More examples
# Filter by address
$ ss -nt dst 74.125.236.178

# CIDR notation is also supported
$ ss -nt dst 74.125.236.178/16

# Address and Port combined
$ ss -nt dst 74.125.236.178:80
Ports can also be filtered with dport/sport options. Port numbers must be prefixed with a ":".
$ ss -nt dport = :80
State      Recv-Q Send-Q      Local Address:Port        Peer Address:Port
ESTAB      0      0             192.168.1.2:56198     108.160.162.37:80
ESTAB      0      0             192.168.1.2:39893      173.255.230.5:80
ESTAB      0      0             192.168.1.2:55043     74.125.236.178:80
The above is same as > ss -nt dst :80
Some more examples of filtering
# source address is 127.0.0.1 and source port is greater than 5000
$ ss -nt src 127.0.0.1 sport gt :5000

# local smtp (port 25) sockets
$ sudo ss -ntlp sport eq :smtp

# port numbers greater than 25
$ sudo ss -nt sport gt :1024

# sockets with remote ports less than 100
$ sudo ss -nt dport \< :100

# connections to remote port 80
$ sudo ss -nt state connected dport = :80
The following operators are supported when comparing port numbers
<= or le : Less than or equal to port
>= or ge : Greater than or equal to port
== or eq : Equal to port
!= or ne : Not equal to port
< or gt : Less than to port
> or lt : Greater than to port
Summary
The above examples cover most of what the ss command supports. For more information check the man pages.
Documentation of the filter syntax can be found in the package iproute2-doc that can be installed on debian/ubuntu systems
$ sudo apt-get install iproute2-doc
The file /usr/share/doc/iproute2-doc/ss.html contains details about the ss command filter syntax.
I’m tried to find ss.html anywhere in debian packages, but as you can see found nothing.
# apt-file search ss.html | grep -w ‘ss.html’
mednafen: /usr/share/doc/mednafen/ss.html
python-pycryptodome-doc: /usr/share/doc/python-pycryptodome-doc/html/src/protocol/ss.html
Thank you very mush for your article, very useful.
I was looking for an alternative between netstat and ss and I’ve found https://agmen.org/netsstat
Good script btw
THX
Thank you! Very useful indeed.
This is very helpful.
Thanks for the examples. Noticed a few things.
Example 5 seems to have incorrect text. [1] The actual output shows dnsmasq is pid 1347 not 1299. [2]
Example 7 seems to have cutoff text. [3]
Example 9 has text saying the command shows all TCP “connected” states [4] however the command example below the text is only showing connections in the established state [5].
[1]
“In the above output the last column contains the process name and pid. In this example dnsmasq is the process name and 1299 is the pid.”
[2]
LISTEN 0 5 127.0.1.1:domain *:* users:((“dnsmasq”,1347,5))
[3]
“The timer information tells how long with ”
[4]
“To display all Ipv4 tcp sockets that are in “connected” state.”
[5]
$ ss -t4 state established
very useful for getting an overview. Thanks!
My experience is that on a RHEL 6 system, netstat -anp takes 0.161 seconds to run, while ss -np takes 6.7 seconds. If by faster you really mean 416 times slower, then I agree.
Thank you for this article. ;)
nice article. good examples.
Very useful information – thank you!
Love that! Thank you very much :)