Iotop is an open-source and free utility Linux command used to display the statistics of disk input/output by processor/threads and print the summary which gets refreshed every second.
It is quite similar to the top command, except that iotop monitors just disk i/o and not other metrics.
This command is particularly useful for system administrators and developers who need to monitor disc usage and identify potential bottlenecks in their systems.
With its customizable output format and ability to filter results, iotop is a powerful tool for optimizing system performance.
The iotop tool is designed in Python language and depends on the kernel module for the execution of the tool to display the disc IO. This makes it an efficient and reliable option for identifying processes that are consuming excessive disc I/O resources, allowing users to take appropriate action to optimize their system performance.
Additionally, iotop provides detailed information on the read and write speeds of individual processes, making it easier to pinpoint specific issues and improve overall system efficiency.
Additionally, iotop can be used in conjunction with other performance monitoring tools to gain a more comprehensive overview of system performance.
Installation
Prerequisites:
- Python version 2.7 or higher
- Kernel version 2.6.20 or higher
Important note - only users having root privileges can execute the iotop command.
For installation of iotop, kindly check on the different flavours of Linux and install it from your package manager.
For Ubuntu
sudo apt install iotop
For CentOS/RHEL/RockyLinux
sudo yum install iotop
For Fedora 22+
dnf install iotop
Note: For this article, we used the Linux OS/Distro "Rocky Linux" version 8.7.
[corpus@linuxworld ~]$ cat /etc/os-release
NAME="Rocky Linux"
VERSION="8.7 (Green Obsidian)"
ID="rocky"
ID_LIKE="rhel centos fedora"
VERSION_ID="8.7"
PLATFORM_ID="platform:el8"
PRETTY_NAME="Rocky Linux 8.7 (Green Obsidian)"
ANSI_COLOR="0;32"
LOGO="fedora-logo-icon"
CPE_NAME="cpe:/o:rocky:rocky:8:GA"
HOME_URL="https://rockylinux.org/"
BUG_REPORT_URL="https://bugs.rockylinux.org/"
ROCKY_SUPPORT_PRODUCT="Rocky-Linux-8"
ROCKY_SUPPORT_PRODUCT_VERSION="8.7"
REDHAT_SUPPORT_PRODUCT="Rocky Linux"
REDHAT_SUPPORT_PRODUCT_VERSION="8.7"
Let's get started with the iotop command now.
Check the iotop Version
'itop –version' or 'itop –v' command helps to get the details of iotop. You can check the output below in Screenshot A - the iotop version is 0.6
[corpus@linuxworld ~]$ iotop --version
iotop 0.6
Using iotop
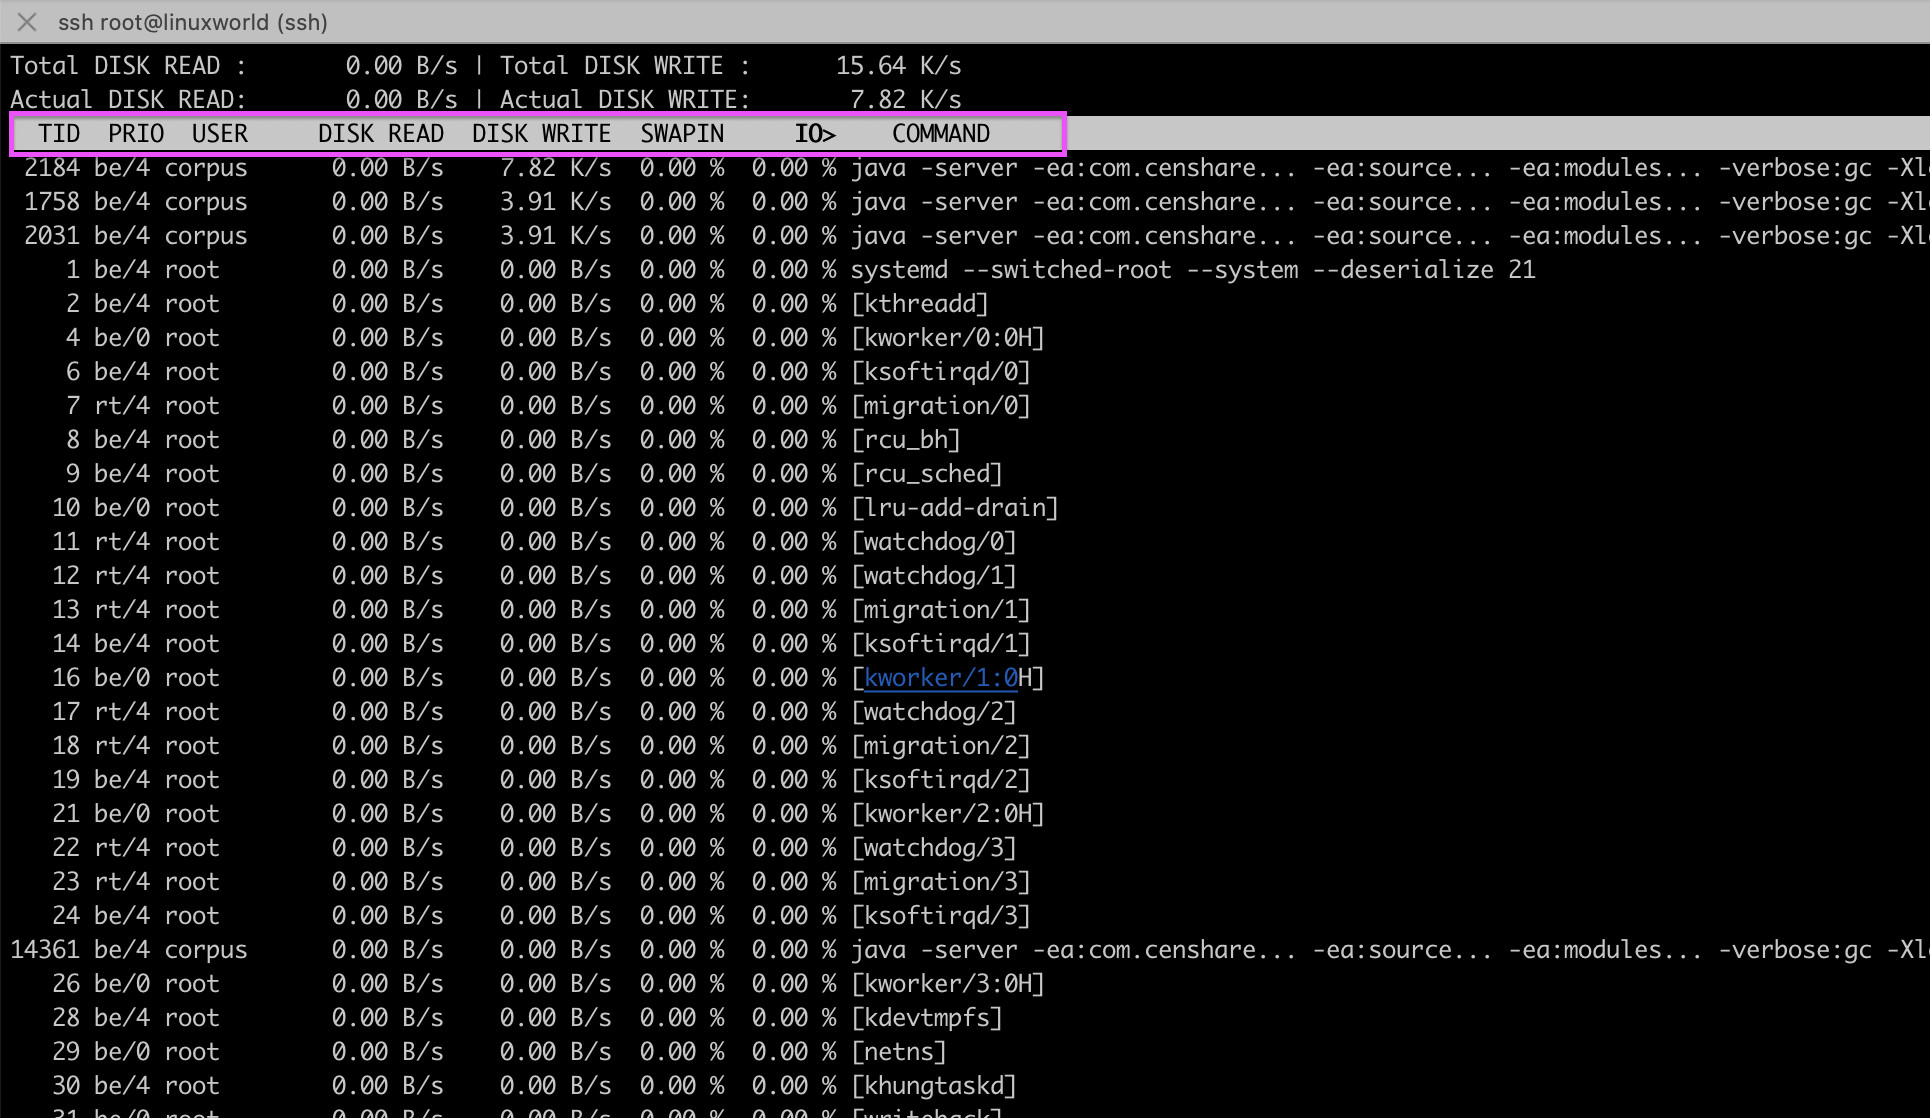
Iotop shows statistics about all processes like the running threads with their current disk usage, which keeps on updating at regular intervals.
Below is the detailed explanation of the above output:
- DISK READ shows the system's processes' or threads' bandwidth for reading data from the disc.
- DISK WRITE shows the system's processes' or threads' capacity for writing data to the disc.
- TID specifies the thread ID
- PID specifies the process ID
- PRIO demonstrates the thread's current I/O priority.
- USER identifies the user who is the process's owner.
- SWAPIN shows how much swap each process is using.
- IO tells you how much of the time the specified process spent making I/O requests.
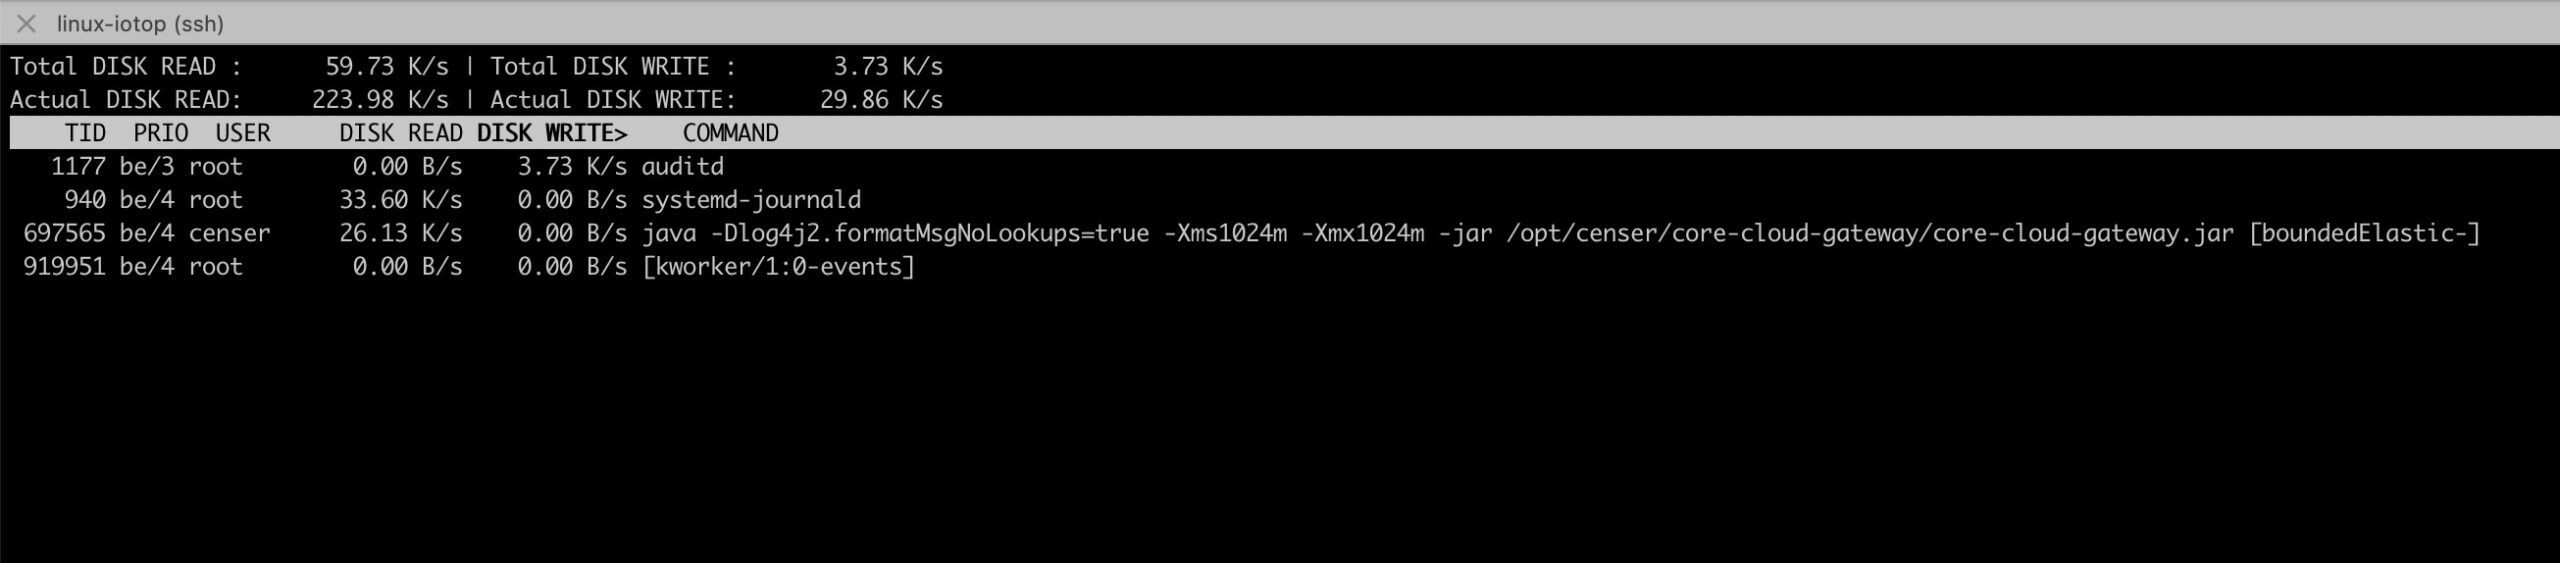
The top of the iotop output displays the overall disc read and write bandwidth. The bandwidth of processes or threads that are actually performing input and output on the disc is shown by the actual disc read and write operations. Data caching and I/O operation reordering in the Linux kernel can cause the total and actual disc read/write values to differ at any given time. Refer Screenshot B.
Screenshot B
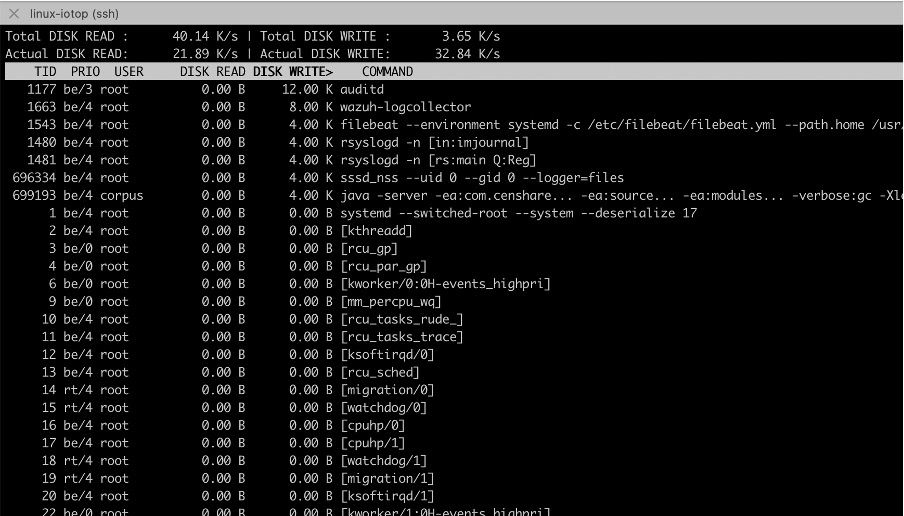
1. Processes doing disk io: iotop -o
This command will list every process that is now performing IO. See Screenshot C.
Screenshot C
2. Iotop -h
This command will display the iotop tool's help menu.
[corpus@linuxworld ~]$ iotop -h
Usage: /usr/sbin/iotop [OPTIONS]

DISK READ and DISK WRITE are the block I/O bandwidth used during the sampling
period. SWAPIN and IO are the percentages of time the thread spent respectively
while swapping in and waiting on I/O more generally. PRIO is the I/O priority at
which the thread is running (set using the ionice command).

Controls: left and right arrows to change the sorting column, r to invert the
sorting order, o to toggle the --only option, p to toggle the --processes
option, a to toggle the --accumulated option, i to change I/O priority, q to
quit, any other key to force a refresh.

Options:
  --version             show program's version number and exit
  -h, --help            show this help message and exit
  -o, --only            only show processes or threads actually doing I/O
  -b, --batch           non-interactive mode
  -n NUM, --iter=NUM    number of iterations before ending [infinite]
  -d SEC, --delay=SEC   delay between iterations [1 second]
  -p PID, --pid=PID     processes/threads to monitor [all]
  -u USER, --user=USER  users to monitor [all]
  -P, --processes       only show processes, not all threads
  -a, --accumulated     show accumulated I/O instead of bandwidth
  -k, --kilobytes       use kilobytes instead of a human friendly unit
  -t, --time            add a timestamp on each line (implies --batch)
  -q, --quiet           suppress some lines of header (implies --batch)
2. Batch Mode Output: iotop –b
This command will display the results in batch or non-interactive mode. Instead of displaying a large list that automatically updates when in batch mode, iotop will continue to produce lines after lines. When logging IO activities over a set amount of time, this is required.
Note: You must kill the programme by pressing Ctrl+C in order to meddle with the output shown in non-interactive mode.
We covered the batch mode and how to use it to monitor processes in a previous article over here:
How to Monitor Disk IO on Linux Server with Iotop and Cron3. Show fixed number of iterations: iotop -n
The number provided as an argument to this command indicates the number of iterations to be performed on the output of iotop. The output will be updated a certain number of times before the programme terminates.
If you use iotop -n 5, for instance, the output will only be refreshed five times automatically.
sudo iotop -n 10
3. Filter Process using pid: iotop -p
The parameter for this command must be an integer that represents the process ID. This command shows the user the IO utilization for a particular process that is listed in the PID.
For instance, sudo iotop -p 77 will only display I/O operations with Process ID 77. See Screenshot E and Screenshot F.
sudo iotop -p 77
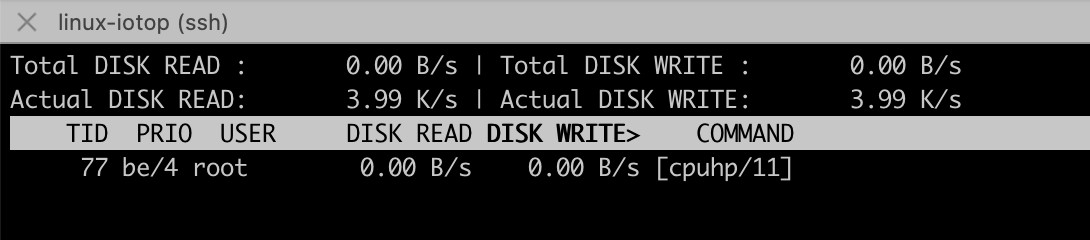
Screenshot F
Report total i/o: iotop -a
Instead of the bandwidth, this command will report the total accumulated i/o since iotop was started. It displays the number of I/O processes ever since iotop began.
Iotop Total Accumulated IO
Show time with each entry: iotop -t
If you wish to keep track of a certain high-IO process, this command will append the timestamp to each line of the output summary, and each line will have the current time.
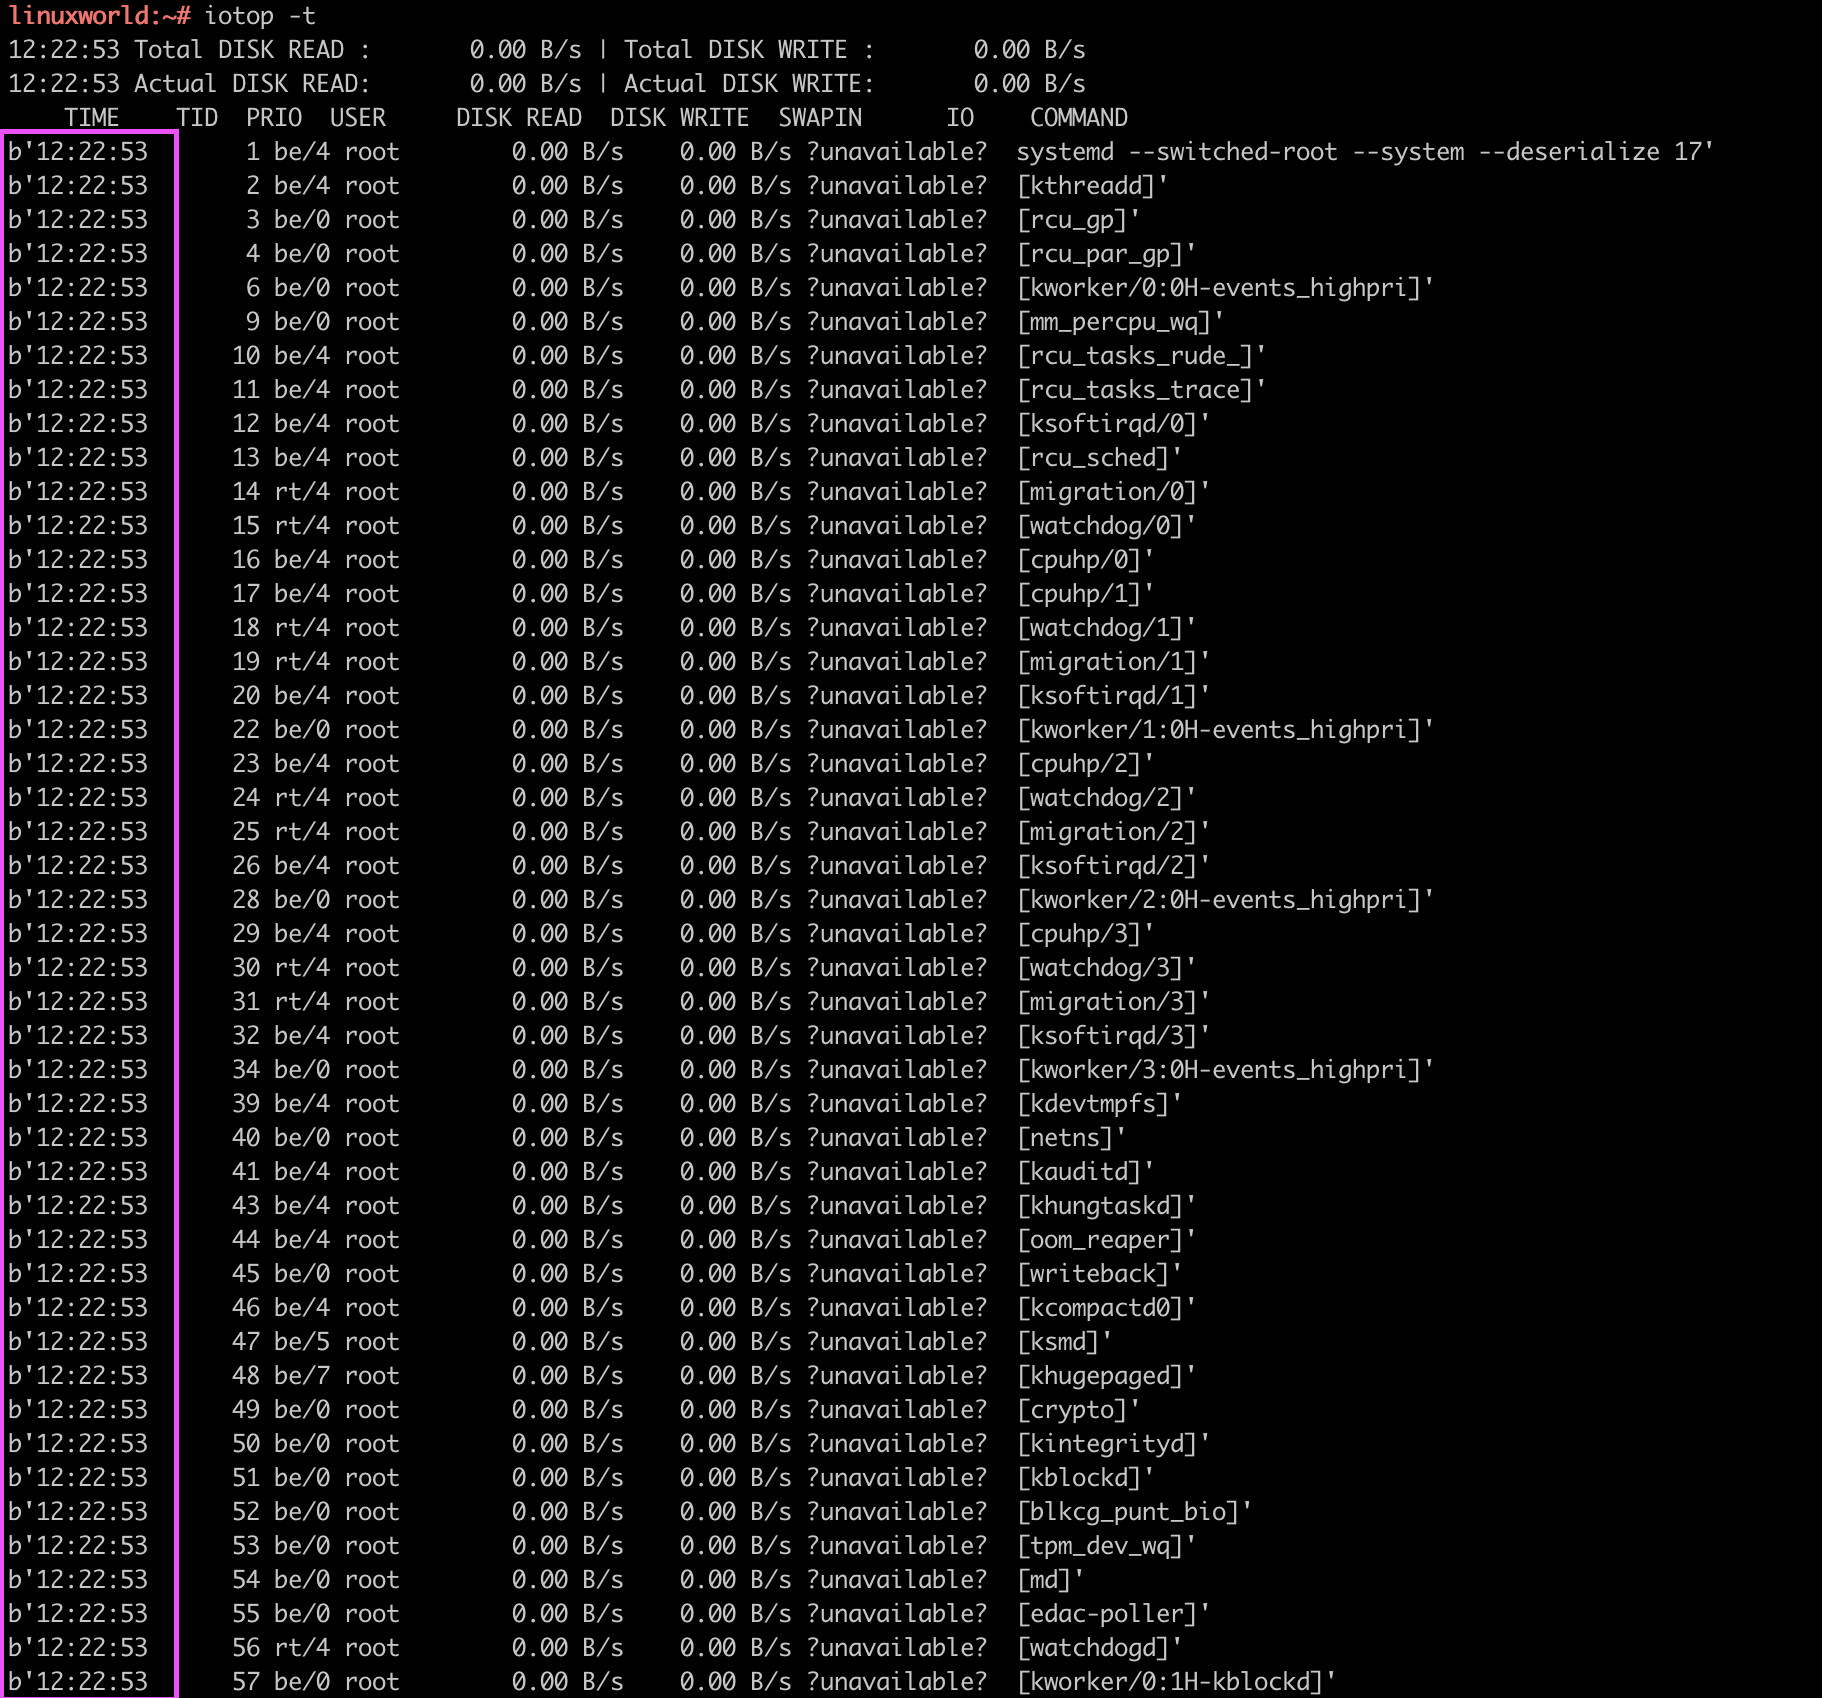
Screenshot H
Hide headers and footer: iotop -q
This command is used to hide output summary header. The top interface will no longer be visible in the output. The -q can be used upto 3 times for suppressing more and more parts of the header/footer. According to the manual:
- -q column names are only printed on the first iteration,
- -qq column names are never printed,
- -qqq the I/O summary is never printed.
The q option automatically enforces the batch mode. Ideally the -q option should be used with -o output.
sudo iotop -qqqo
Monitor specific user accounts: iotop -u
To monitor the details of a specific user in the system, there must be an argument from that user. It shows the threads or processes that a certain user is running.
For instance, just the I/O usages for the user corpus are shown with the following command:
sudo iotop -u corpus
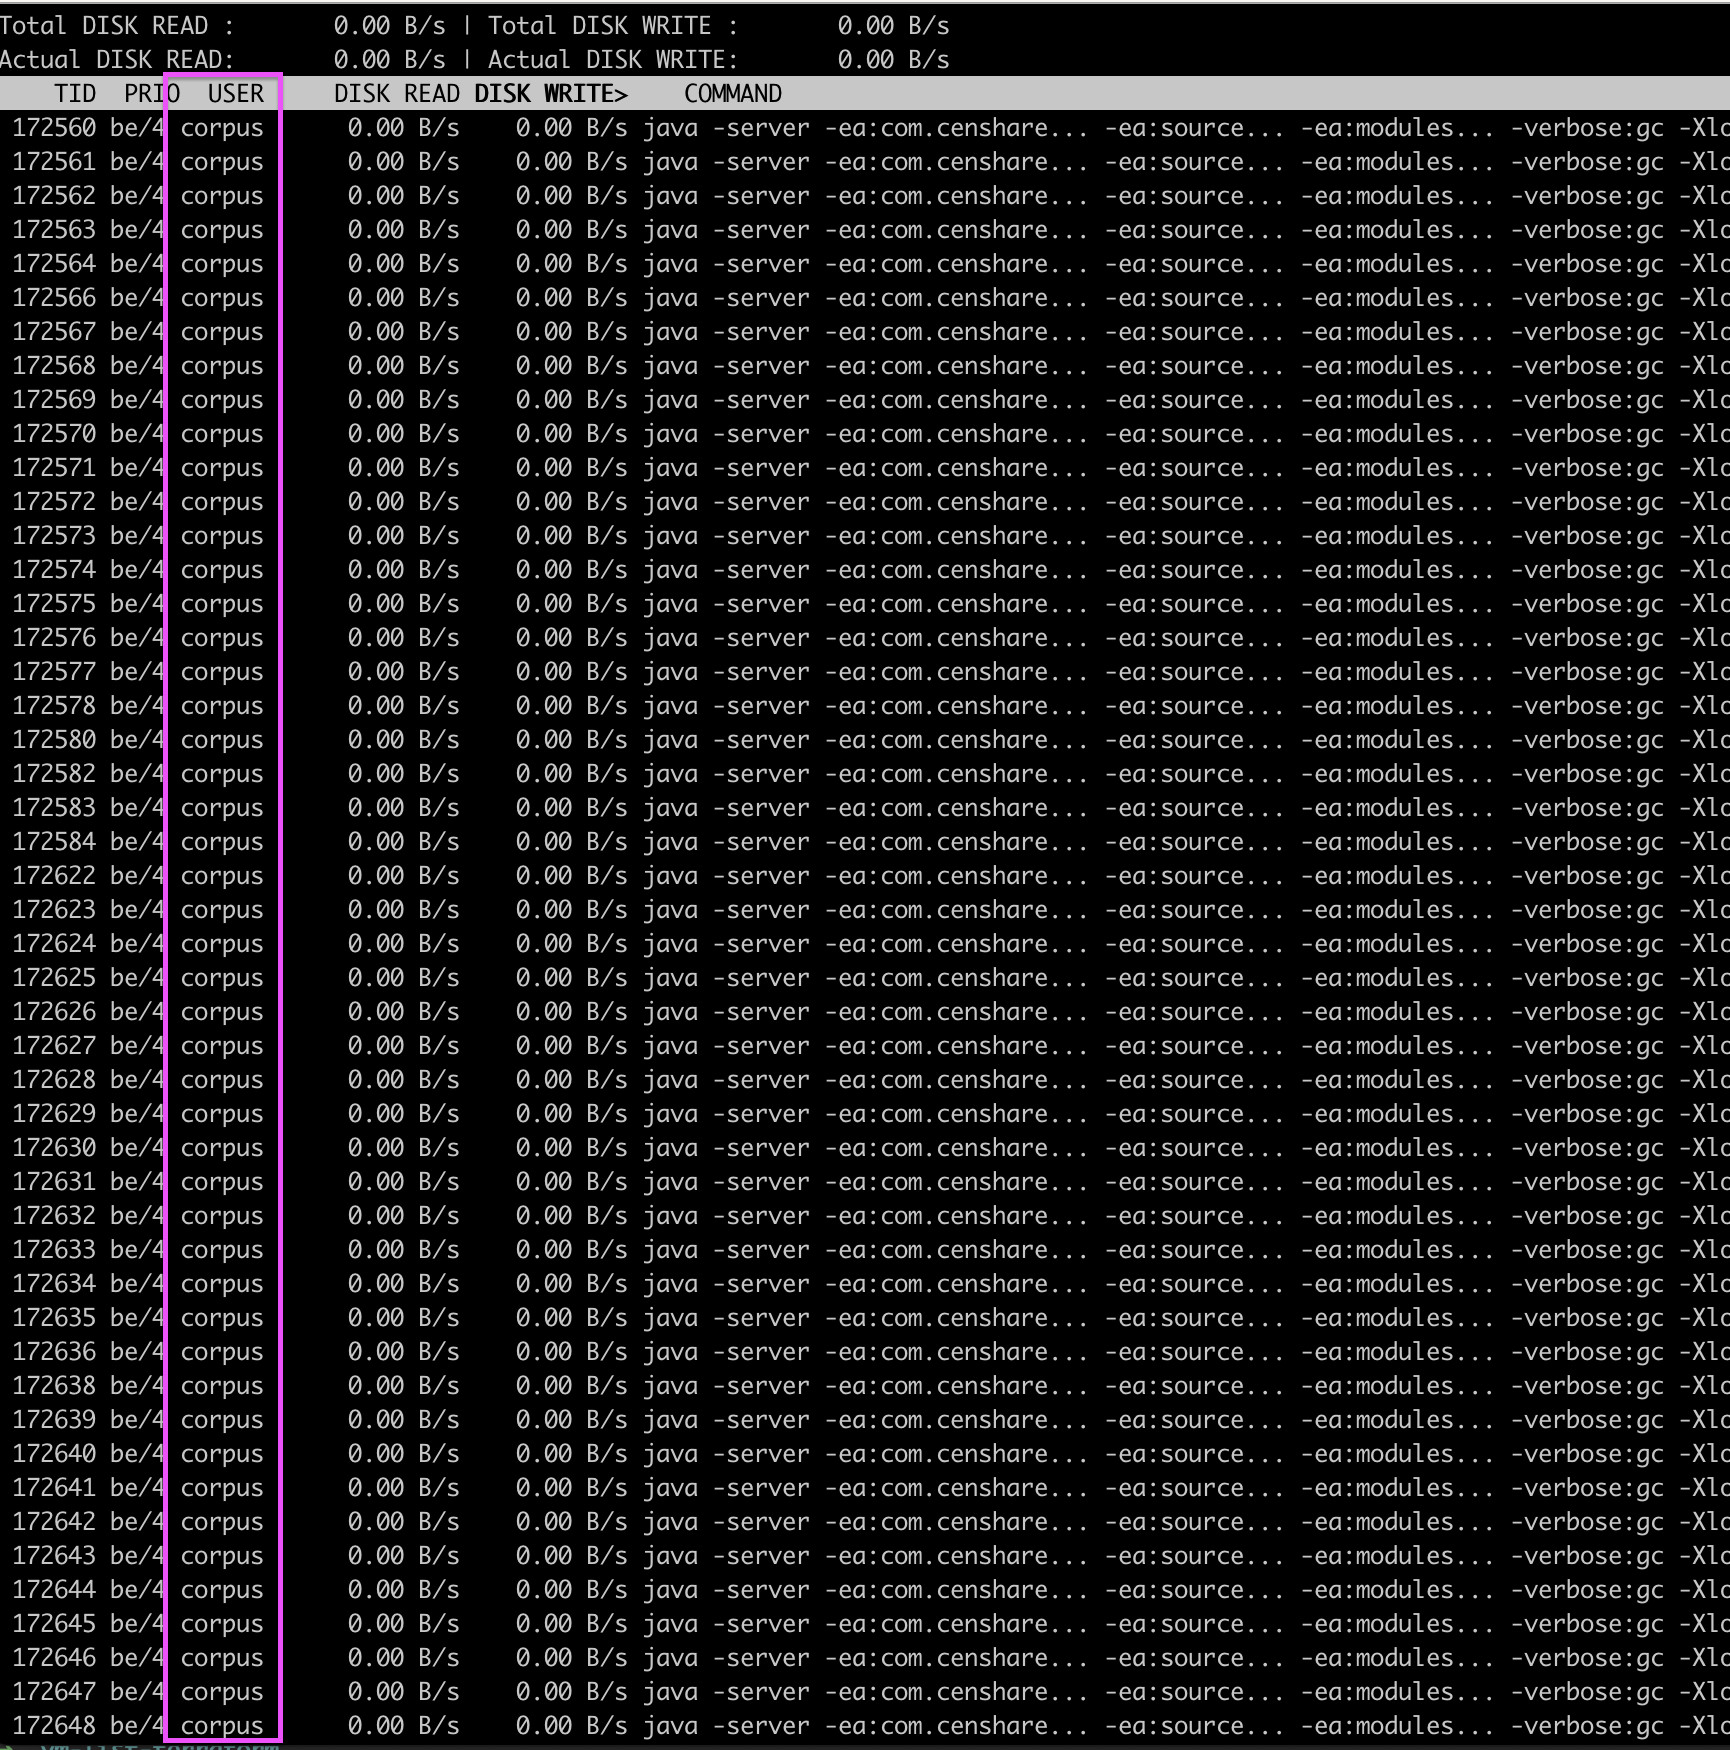
Screenshot I
Use KB as the unit: iotop -k
Only KB/s will be used as the unit to report the bandwidth. Otherwise, depending on the size, it is typically displayed in bytes, kilobytes, and megabytes.
The output below shows that the file greater than 1024 kilobytes is also displayed in kilobytes.
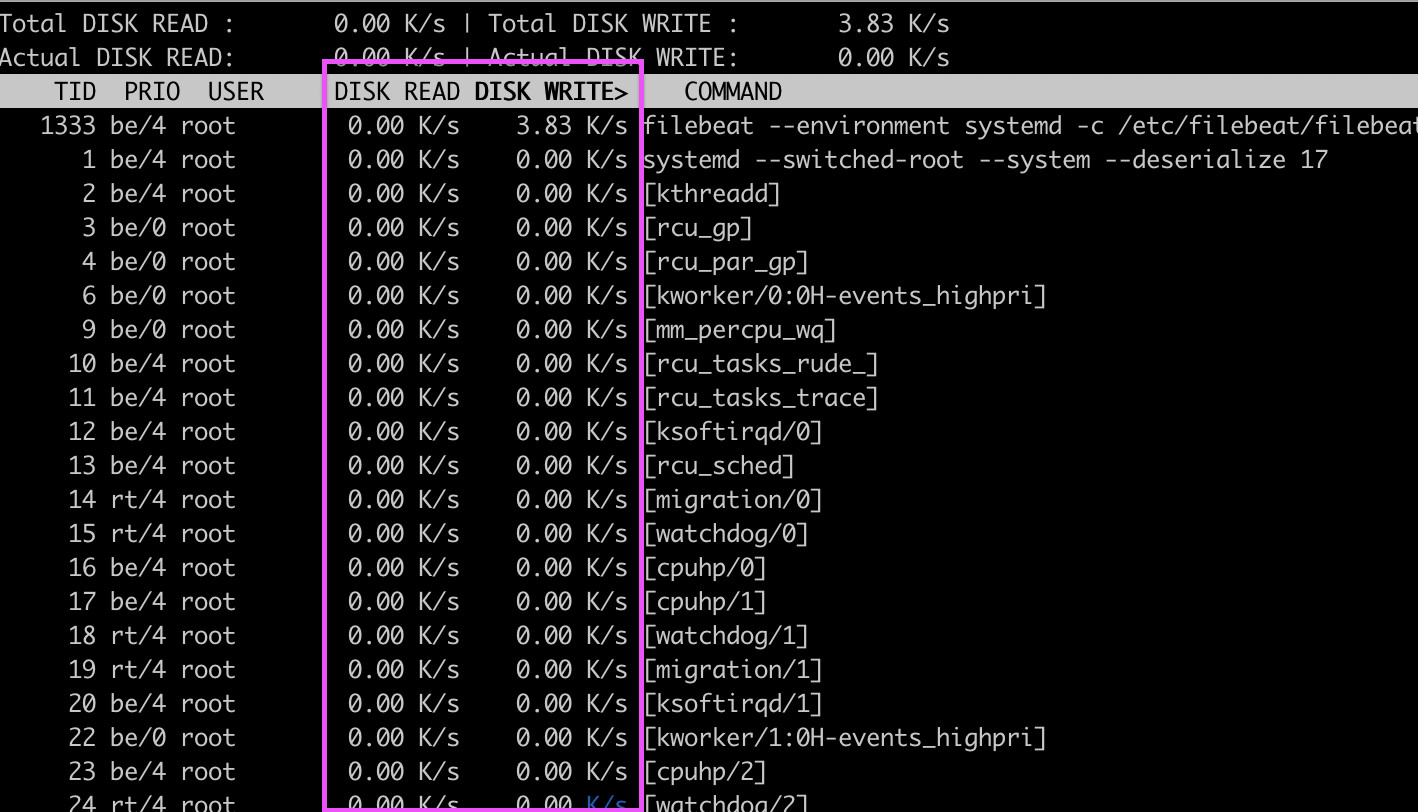
Screenshot J
Adjust the delay: iotop -d
The -d option can be used to specify the interval in seconds at which the output should be updated.
To update the output every 3 seconds we can use the following command
sudo iotop -d 3
Automating with cron
To automate the operation, we can set the cron job to run iotop once every minute to monitor the disc I/O.
Create a separate cron configuration file at the location '/etc/cron.d/iotop' file.
sudo nano /etc/cron.d/iotop
Add the below shown line
* * * * * root /usr/sbin/iotop -botqqqk --iter=30 >> /var/log/iotop
And the reasons why we utilize the -b, -o, -t, -q, and -k parameters are already covered above.
Now, cron would execute the programme once every minute for a total of 30 seconds, taking samples at 1-second intervals, and logging all activity to /var/log/iotop.
The following are some useful keyboard shortcuts for the iotop command:
- To modify the sorting, use the left and right arrow keys.
- To change the sorting order, press the r key.
- Instead of displaying all processes or threads, press the o key to just see those that are now performing I/O.
- Click the only display processes button. Iotop typically displays all threads.
- Click the accumulated I/O display instead of the bandwidth. Iotop displays the number of I/O processes in this mode.
Conclusion
So far we learned how useful the iotop command can be when debugging a system that is slowing down due to increased I/O activity. Every linux administrator uses such tools to determine why the system is behaving abnormally.
The iotop command has limited features and functionality. If you want to log the disk i/o activities for specific processes or user accounts then iotop is sufficient. However for more interactive monitoring, its better to use tools like htop or btop.
We recommend that you investigate such useful tools in order to resolve I/O performance issues on your linux system.
The `iotop` command in Linux is a tool that provides real-time monitoring of disk I/O usage by processes on a system. While `iotop` is a useful utility for gaining insights into disk I/O behavior, there are a few potential problems or limitations associated with its usage:
1. Root Privileges: Running `iotop` typically requires root privileges because it needs access to kernel-level I/O statistics. This means you need to run it with `sudo`, which might not always be feasible or desired for all users.
2. System Impact: Monitoring I/O usage in real-time can consume system resources itself, potentially affecting the overall system performance. This impact might be more pronounced on systems with heavy I/O loads or limited resources.
3. Limited Historical Data: `iotop` provides real-time data but does not offer a history of disk I/O usage over time. If you need to analyze historical I/O patterns or trends, you might need to complement `iotop` with other tools that collect and store historical data.
4. Complexity and Learning Curve: Understanding the various columns and data presented by `iotop` might require some familiarity with disk I/O concepts and Linux internals. This can be a challenge for users who are not well-versed in these areas.
5. Dependency and Availability: `iotop` might not be installed by default on all Linux distributions. Users need to ensure that it is available on their system or install it using package managers.
6. Non-Standard Behavior: Different versions of `iotop` might have slightly different behavior and options depending on the distribution and version of Linux. This can lead to inconsistencies when moving between different systems.
7. Process Identifier (PID) Changes: In systems with dynamic processes, the PIDs of processes can change over time. This can make it challenging to track specific processes’ I/O usage accurately.
8. External Dependencies: `iotop` relies on the `python` and `psutil` libraries to gather and display I/O information. If these dependencies are not present or configured correctly, `iotop` might not function as expected.
Despite these potential problems, `iotop` remains a valuable tool for gaining insights into real-time disk I/O usage by processes on a Linux system. Users can manage and mitigate these issues by considering the limitations and being aware of the potential impact on their system’s performance.