Nmon
Nmon (Nigel's performance Monitor for Linux) is another very useful command line utility that can display information about various system resources like cpu, memory, disk, network etc. It was developed at IBM and later released open source.
It is available for most common architectures like x86, ARM and platforms like linux, unix etc. It is interactive and the output is well organised similar to htop.
Using Nmon it is possible to view the performance of different system resources on a single screen.
The man page describes nmon as
nmon is is a systems administrator, tuner, benchmark tool. It can display the CPU, memory, network, disks (mini graphs or numbers), file systems, NFS, top processes, resources (Linux version & processors) and on Power micro-partition information.
Project website
http://nmon.sourceforge.net/
Install Nmon
Debian/Ubuntu type distros have nmon in the default repos, so grab it with apt.
$ sudo apt-get install nmon
Fedora users can get it with yum
$ sudo yum install nmon
CentOS users need to install nmon from rpmforge/repoforge repository. It is not present in Epel.
Either download the correct rpm installer from
Or setup the rpmforge repository by following the instructions here
http://wiki.centos.org/AdditionalResources/Repositories/RPMForge
And then install using yum
$ sudo yum install nmon
View cpu, memory, network usage
Using nmon requires no effort at all. Just type nmon and hit enter and you would be presented with a welcome screen similar to the one shown below.
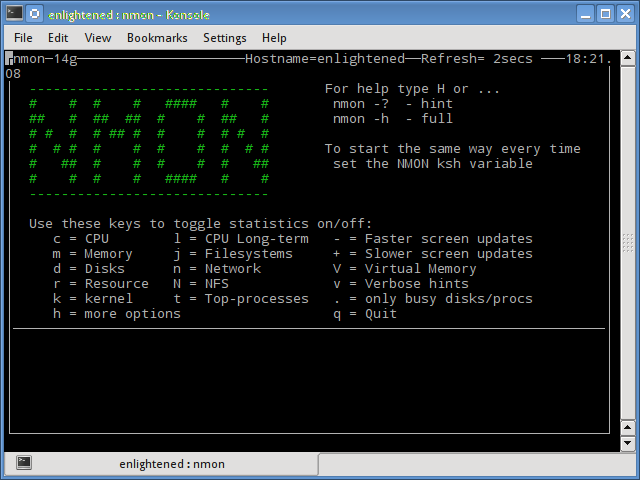
Nmon is fully interactive, and the help section on the welcome screen tells you what to do next. Press C, M, N, D to display cpu, memory, network, disk etc in any order. Pressing t would display the top running processes.
Here is how it looks when checking up cpu usage, memory usage and network usage.
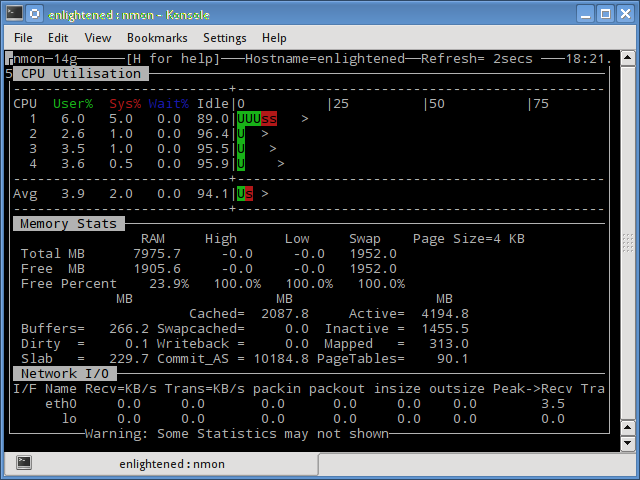
To display/hide a details of any particular metric, just press the associated key.
Use these keys to toggle statistics on/off:
c = CPU
l = CPU Long-term
m = Memory
j = Filesystems
d = Disks
n = Network
r = Resource
N = NFS
k = kernel
t = Top-processes
h = more options
- = Faster screen updates
+ = Slower screen updates
V = Virtual Memory
v = Verbose hints
. = only busy disks/procs
q = Quit
View process details like top/htop
To view the process details press the t button. If the screen height falls short, then you need to hide other sections.
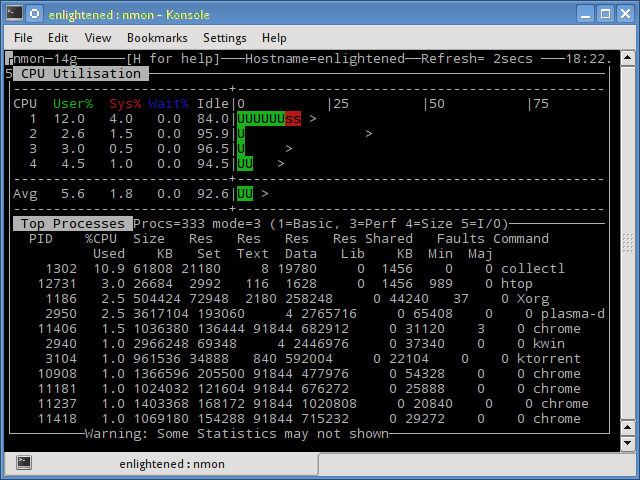
Use the + and - keys to control the update speed. Pressing + would make it update slower.
Nmon can take up some options directly from command line options while starting. To set the update delay use the s option
$ nmon -s 1
Setup default options to save time
To avoid the welcome screen everytime and get straight to the stats, setup an environment variable called NMON as follows
$ export NMON=mndc
$ nmon
Nmon will now go straight to the stats screen without presenting the welcome screen. Don't forget to add the export command to ~/.bashrc to keep it persistent across reboots.
Summary
There are a few more options that nmon supports. Run 'nmon -h' to get a full tutorial. The r option would print some useful details about the linux installation and cpu.
Nmon is useful when you need an overview of different system resources on a single screen. It cannot provide indepth details about any system resource.
Apart from showing the data on screen, nmon can also write it to a spreadsheet file for later analysis, with the f option.
$ nmon -f
The files are created in the home directory. Check the Getting Started page on its wiki for more information.