So recently I was looking for a command to check the live power consumption of cpu in watts. I tried different commands like powertop, powerstat, lm-sensors but none of them worked properly.
lm-sensors did show the temperatures of individual cores of the cpu, but could not display the watts being consumed in realtime. Other commands like powertop and powerstat also were not able to show up the information i wanted.
Finally found 2 new commands called turbostat and s-tui that were able to do the task.
When doing stress tests on cpu, its important to monitor the power consumption and temperatures to see how much power is being drawn and how effectively is it being dissipated by the cooling system. Such tests are done both desktop pcs and laptops.
The power metric can be used to check the maximum drawn power under full load and helps us decide as to what kind of psu would be best suitable for a target desktop build and the temperature data along with tdp values lets us decide which cooler would be best for the cpu.
Its not just about diagnostics but also selecting parts for a new build.
1. Turbostat
Turbostat is an excellent command line utility that can measure and monitor lots of hardware metrics on the system.
If its not already available on the system, it should be possible to install it with the apt-get or apt command.
root@li240-5:~# turbostat
Command 'turbostat' not found, but can be installed with:
apt install linux-intel-iotg-tools-common  # version 5.15.0-1017.22, or
apt install linux-nvidia-tools-common      # version 5.15.0-1007.7
apt install linux-tools-common             # version 5.15.0-52.58
root@li240-5:~#
The following turbostat command example displays the cpu usage (%), clock frequency (mhz), temperature (C) and power consumption (watts). These are the 4 most important performance metrics to check when stress testing the cpu.
$ sudo turbostat --Summary --quiet --show Busy%,Avg_MHz,PkgTmp,PkgWatt --interval 1
Avg_MHz Busy%   PkgTmp  PkgWatt
86      4.92    52      3.89
101     5.04    52      4.42
91      5.10    51      3.81
100     5.14    52      4.34
100     5.90    51      3.96
160     6.73    53      5.64
185     11.30   52      5.70
364     18.40   52      8.16
230     15.39   52      5.76
657     29.90   63      11.14
382     21.21   53      7.24
552     28.48   53      9.31
415     20.86   52      8.10
949     37.65   64      15.37
1204    35.40   63      24.98
1275    40.87   53      23.28
1385    50.62   56      20.67
914     46.80   53      12.57
423     26.42   53      7.07
2696    83.71   64      34.41
2978    89.87   64      37.54
2907    87.59   66      37.18
3044    91.87   64      38.65
2993    90.31   67      38.26
3152    95.35   69      39.86
3219    97.40   67      41.21
3247    98.31   68      41.72
3281    99.39   68      42.44
3256    98.62   69      42.23
3192    96.61   73      41.89
3244    98.23   69      42.27
3298    99.93   69      42.60
3300    100.00  70      42.63
3300    100.00  70      42.72
3300    100.00  71      42.73
The column PkgWatt shows the power consumption watts. As the usage increases so does the watt intake along with the temperature of the cpu.
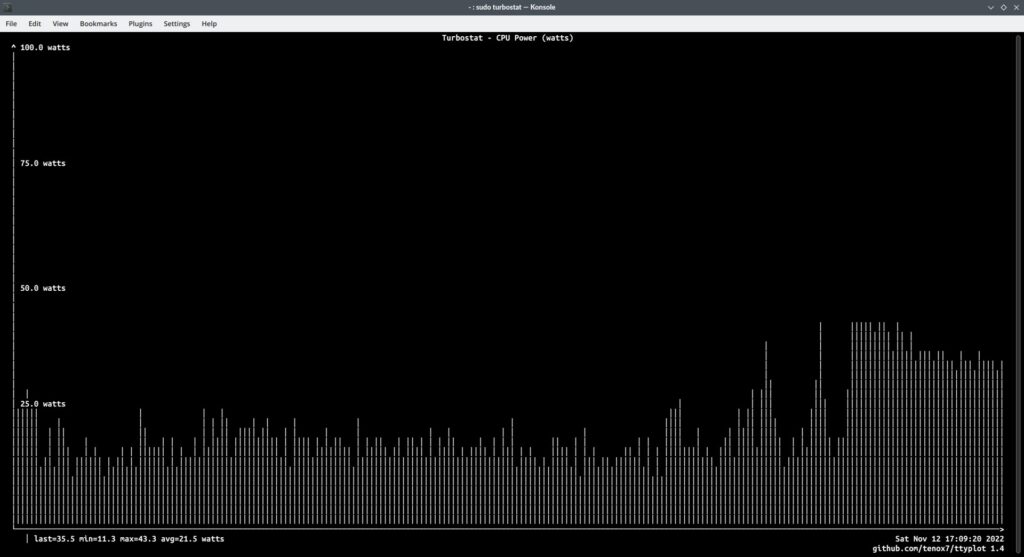
To plot the graph of the power consumption use the ttyplot utility as shown below:
$ sudo turbostat --Summary --quiet --show PkgWatt --interval 1 | gawk '{ printf("%.2f\n" , $1); fflush(); }' | ttyplot -s 100 -t "Turbostat - CPU Power (watts)" -u "watts"
The above command will use gawk to extract the wattage data and feed it to ttyplot, which will then plot a decent graph in the terminal itself. Not very fancy but good enough!
2. s-tui - The Stress Terminal UI
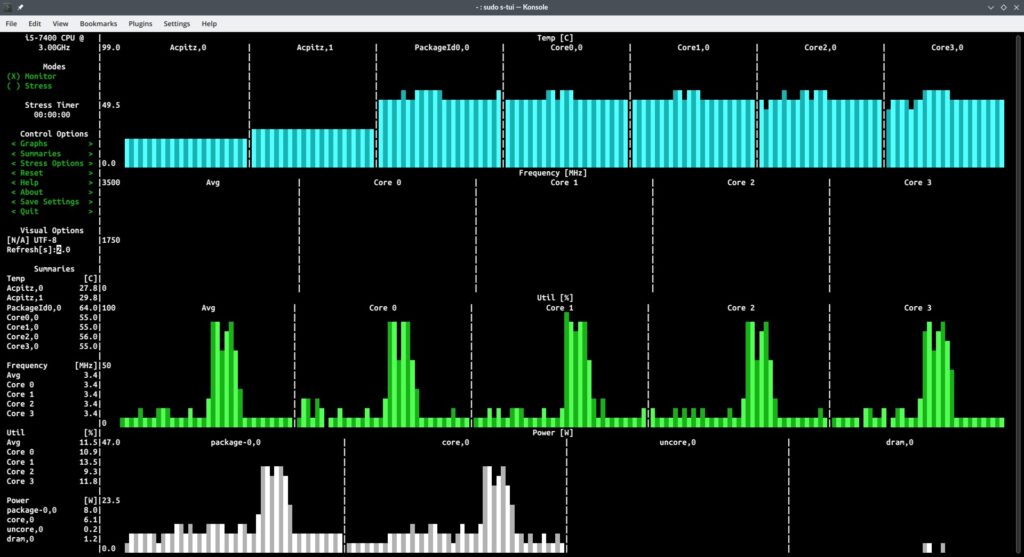
The next tool is s-tui which displays data in both tabular and graphical format. Its needs to be run with root privileges in order to extract and display power information.
Install it using apt-get on ubuntu.
sudo apt-get install s-tui
On Fedora s-tui can be installed from the main repository using dnf. Run "sudo dnf install s-tui" and you are done.
Now run with root privileges:
sudo s-tui
Thats it, and now you should be able to view the desired data.
Conclusion
I have tested both turbostat and s-tui on multiple cpus like i5-7400 (desktop), i5-1135g7 (laptop), ryzen 7 5800h (laptop) and ryzen 5 5500u (laptop) and they work pretty well on all systems.
The tools should show power information on most modern cpus from both intel and amd.
The power information will not be available if you are running linux in a virtual machine like virtualbox, so don't bother.


This is interesting, thanks to turbostat I can see the C-states in a nice table. But I am not sure about the absolute values, especially with only the Watts for “pkg”. With “perf stat” there is also a “psys”. Here two lines from a one-second-run, 1 Joule = 1 Watt/second:
1.26 Joules energy-psys
0.80 Joules energy-pkg
…
Even this energy-psys only “reflects” the Watts indicated by my real (external) power meter. I read between 2.8 – 4.2 W depending on the kernel/distro. Good idling is with 3.2W real, 1W psys and a cool case. Not-so-good is 3.8W real, 3W psys and “feverish” case after 15 minutes. I am not even convinced the power meter manages to measure the (variable?) current precisely.
25 W noturbo, 75% pstate limit
4.0 W minimal activity / bad idling
3.2 W good idling (can even stay at 2.8 W – but how exactly?!?)
1.8 W “freeze”
1.1 W suspend-to-ram
0.9 W (!) Main power Off
This is with a 2017 intel nuc mini-pc. The numbers show you CAN get quite close to “freeze” system state. Feeling the warmth of the case is the best control, especially when the fan is not blowing (yet).
that’s a good idea, specially for a “mobile” form factor device that can tell its heat levels through body touch.