Memory Usage
On linux, there are commands for almost everything, because the gui might not be always available. When working on servers only shell access is available and everything has to be done from these commands. So today we shall be checking the commands that can be used to check memory usage on a linux system. Memory include RAM and swap.
It is often important to check memory usage and memory used per process on servers so that resources do not fall short and users are able to access the server. For example a website. If you are running a webserver, then the server must have enough memory to serve the visitors to the site. If not, the site would become very slow or even go down when there is a traffic spike, simply because memory would fall short. Its just like what happens on your desktop PC.
1. free command
The free command is the most simple and easy to use command to check memory usage on linux. Here is a quick example
$ free -m
             total       used       free     shared    buffers     cached
Mem:          7976       6459       1517          0        865       2248
-/+ buffers/cache:       3344       4631
Swap:         1951          0       1951
The m option displays all data in MBs. The total os 7976 MB is the total amount of RAM installed on the system, that is 8GB. The used column shows the amount of RAM that has been used by linux, in this case around 6.4 GB. The output is pretty self explanatory. The catch over here is the cached and buffers column. The second line tells that 4.6 GB is free. This is the free memory in first line added with the buffers and cached amount of memory.
Linux has the habit of caching lots of things for faster performance, so that memory can be freed and used if needed.
The last line is the swap memory, which in this case is lying entirely free.
2. /proc/meminfo
The next way to check memory usage is to read the /proc/meminfo file. Know that the /proc file system does not contain real files. They are rather virtual files that contain dynamic information about the kernel and the system.
$ cat /proc/meminfo
MemTotal:        8167848 kB
MemFree:         1409696 kB
Buffers:          961452 kB
Cached:          2347236 kB
SwapCached:            0 kB
Active:          3124752 kB
Inactive:        2781308 kB
Active(anon):    2603376 kB
Inactive(anon):   309056 kB
Active(file):     521376 kB
Inactive(file):  2472252 kB
Unevictable:        5864 kB
Mlocked:            5880 kB
SwapTotal:       1998844 kB
SwapFree:        1998844 kB
Dirty:              7180 kB
Writeback:             0 kB
AnonPages:       2603272 kB
Mapped:           788380 kB
Shmem:            311596 kB
Slab:             200468 kB
SReclaimable:     151760 kB
SUnreclaim:        48708 kB
KernelStack:        6488 kB
PageTables:        78592 kB
NFS_Unstable:          0 kB
Bounce:                0 kB
WritebackTmp:          0 kB
CommitLimit:     6082768 kB
Committed_AS:    9397536 kB
VmallocTotal:   34359738367 kB
VmallocUsed:      420204 kB
VmallocChunk:   34359311104 kB
HardwareCorrupted:     0 kB
AnonHugePages:         0 kB
HugePages_Total:       0
HugePages_Free:        0
HugePages_Rsvd:        0
HugePages_Surp:        0
Hugepagesize:       2048 kB
DirectMap4k:       62464 kB
DirectMap2M:     8316928 kB
Check the values of MemTotal, MemFree, Buffers, Cached, SwapTotal, SwapFree.
They indicate same values of memory usage as the free command.
3. vmstat
The vmstat command with the s option, lays out the memory usage statistics much like the proc command. Here is an example
$ vmstat -s
      8167848 K total memory
      7449376 K used memory
      3423872 K active memory
      3140312 K inactive memory
       718472 K free memory
      1154464 K buffer memory
      2422876 K swap cache
      1998844 K total swap
            0 K used swap
      1998844 K free swap
       392650 non-nice user cpu ticks
         8073 nice user cpu ticks
        83959 system cpu ticks
     10448341 idle cpu ticks
        91904 IO-wait cpu ticks
            0 IRQ cpu ticks
         2189 softirq cpu ticks
            0 stolen cpu ticks
      2042603 pages paged in
      2614057 pages paged out
            0 pages swapped in
            0 pages swapped out
     42301605 interrupts
     94581566 CPU context switches
   1382755972 boot time
         8567 forks
$
The top few lines indicate total memory, free memory etc and so on.
4. top command
The top command is generally used to check memory and cpu usage per process. However it also reports total memory usage and can be used to monitor the total RAM usage. The header on output has the required information. Here is a sample output
top - 15:20:30 up  6:57,  5 users,  load average: 0.64, 0.44, 0.33
Tasks: 265 total,   1 running, 263 sleeping,   0 stopped,   1 zombie
%Cpu(s):  7.8 us,  2.4 sy,  0.0 ni, 88.9 id,  0.9 wa,  0.0 hi,  0.0 si,  0.0 st
KiB Mem:   8167848 total,  6642360 used,  1525488 free,  1026876 buffers
KiB Swap:  1998844 total,        0 used,  1998844 free,  2138148 cached

  PID USER      PR  NI  VIRT  RES  SHR S  %CPU %MEM    TIME+  COMMAND
 2986 enlighte  20   0  584m  42m  26m S  14.3  0.5   0:44.27 yakuake
 1305 root      20   0  448m  68m  39m S   5.0  0.9   3:33.98 Xorg
 7701 enlighte  20   0  424m  17m  10m S   4.0  0.2   0:00.12 kio_thumbnail
Check the KiB Mem and KiB Swap lines on the header. They indicate total, used and free amounts of the memory. The buffer and cache information is present here too, like the free command.
5. htop
Similar to the top command, the htop command also shows memory usage along with various other details.
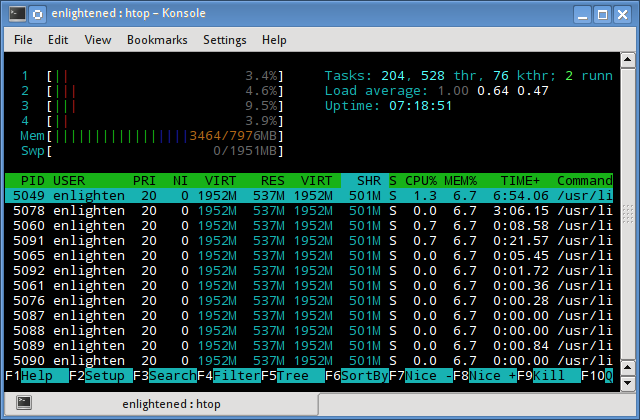
The header on top shows cpu usage along with RAM and swap usage with the corresponding figures.
RAM Information
To find out hardware information about the installed RAM, use the demidecode command. It reports lots of information about the installed RAM memory.
$ sudo dmidecode -t 17
# dmidecode 2.11
SMBIOS 2.4 present.

Handle 0x0015, DMI type 17, 27 bytes
Memory Device
        Array Handle: 0x0014
        Error Information Handle: Not Provided
        Total Width: 64 bits
        Data Width: 64 bits
        Size: 2048 MB
        Form Factor: DIMM
        Set: None
        Locator: J1MY
        Bank Locator: CHAN A DIMM 0
        Type: DDR2
        Type Detail: Synchronous
        Speed: 667 MHz
        Manufacturer: 0xFF00000000000000
        Serial Number: 0xFFFFFFFF
        Asset Tag: Unknown
        Part Number: 0x524D32474235383443412D36344643FFFFFF
Provided information includes the size (2048MB), type (DDR2) , speed(667 Mhz) etc.
Summary
All the above mentioned commands work from the terminal and do not have a gui. When working on a desktop with a gui, it is much easier to use a GUI tool with graphical output. The most common tools are gnome-system-monitor on gnome and
ksysguard on KDE. Both provide resource usage information about cpu, ram, swap and network bandwidth in a graphical and easy to understand visual output.
Thanks for informations,
it is very helpfull to see for Linux Lite Versions to see how many ram is used by using small ram older notebooks as example the ideapad 100 modell 14 141I with 2 GB RAM.
So i can s-good ee what i can install better to take the ZorinOS 15, ZorinOS 15 lite or Lubuntu
Thanks for the valuable information..Linux command-line tools to check system memory usage
Anyone can share Linux command to set Cron job and access MySQL.
you can use mysql event for automation , thank me later
It’s very helpful for experienced and beginners
it is a good reference for memory-related commands. thanks for share it.
Use “free -h” for human readable output
Thank you very much
Very helpfull for all
i have enough memory in my server(16 go), please tell me how to free buffers/cache memory
free -m
total used free shared buffers cached
Mem: 16052 15958 93 0 68 8858
-/+ buffers/cache: 7030 9021
Swap: 24575 89 24486
swapoff -a && swapon -a
That’s a great article, thank you for the commands.
I’ll definitely use them in order to monitor my RAM.
Any thoughts about memory monitoring using modern solutions such as Prometheus and Grafana?
An excellently written article, This is a good article which offers some helpful information for me, I will read more. I hope we can learn from each other.
E-Learning – Anytime, Anywhere | Automation Laboratories | Noida | Pune
Thanks for sharing useful commands
Great Tutorial.
My Favorite is free- m command I always use this command to check the free memory before deploying a new application on my server.
Very good article found helpful
htop command is really useful
it helped me to solve my server’s over usage problem.
special thanks to Silver Moon!
Thanks for the commands, it is very helpful
Thanks for sharing. Please, can you provide a command to kill a process using a specific port?
netstat -pl | grep “port” ### will retrun pid associated with this port
kill -9 pid ####kill that pid
check out https://github.com/TeoGia/jotun
Its a simple program that outputs heap usage in json format
Great write up, useful on how to read the memory used on the linux system, I also created an easy script to show a summary of free ram in a percentage and also list when you need to worry, i got the idea from the linux ate my ram webpage.
https://www.myrandomtips.com/linux/linux-ate-my-ram/
I always use command
> sar -r 1 10
Its shows memory usage for each seconds for 10 seconds. try it.
hi ..
I wanted to find the heap memory usage in a linux machine for every 10sec .. Do you have any command.
If you know any tool which gives graphical representation of Heap memory usage .. that will be more helpful.
Thanks,
Sateesh
Thnaks
I have a question, how to use ram access for each person?
linux working fne with spring boot for developing java application
Spring Boot is the best Java framework for microservices. We recommend you to become an expert at Spring Boot!
https://javatrainingchennai.tistory.com/22
It’s really helpful.
Is there any way to monitor memory usage in real time.
Something like a script which checks the memory usage and sending the report to a particular email id in a given interval of time.
I did a script like that, check my syswatch script here:
https://github.com/jonaski/shellscripts/tree/master/monitoring
Thanks Jonas
Indeed, it is a good reference for memory related commands.
Thank you … dmidecode shows me everything about my server …
Thank for sharing. I have a question.
How to get ram usage for each process?
df -kh
How to check which resources are taking max memory in Ubuntu 16.04
RAM=$(( $(( $(sudo dmidecode -t 17 2>/dev/null | grep ‘Size:’ | grep -o ‘[[:digit:]]\+’ | paste -s -d+ -) )) * 1024 * 1024))
Your command here is very useful.
Thank you so much!
thanks a lot it helped me
jmx resolution process?
what is the resolve process for jmx alerts like( live thread alerts)?
To output USED memory (minus buffers and cache) PERCENT you can use a command like:
% free | awk ‘FNR == 3 {print $3/($3+$4)*100}’
23.8521
This grabs the third line and divides used/total * 100.
And for free memory PERCENT:
% free | awk ‘FNR == 3 {print $4/($3+$4)*100}’
76.0657
From: https://unix.stackexchange.com/questions/152299/how-to-get-memory-usedram-used-using-linux-command
Thanks! Very useful tips!
Debian server was inaccessible after some days , no ssh etc. and the error was no resources are available.
Through console server is not accepting any command, Then I need to hard reset the server, what could be the issue ?
We are running voip application on this server.
My server memory indicator is on and the error is “Uncorrectable Error detected for “Memory Device 14” on subsystem “System Memory””. Is there any way to fix it instead of rebooting the server?
:~# echo 3 > /proc/sys/vm/drop_caches
bash: /proc/sys/vm/drop_caches: Permission denied
Since this is a non-destructive operation and dirty objects are not freeable, the user should run ‘sync’ first.
Option 1: Free pagecache.
sudo bash -c “sync; echo 1 > /proc/sys/vm/drop_caches”
Option 2: Free dentries and inodes info.
sudo bash -c “sync; echo 2 > /proc/sys/vm/drop_caches”
Option 3: Free the whole lot – pagecache, dentries and inodes.
sudo bash -c “sync; echo 3 > /proc/sys/vm/drop_caches”
Thanks, nice tips
Hi there,
I have a UNIX box. In that totally 8 servers running.. Any one tell me how to chk the memory info of those servers..
Thanx in advance
hello siva you can use a single different different terminal on the screen then login to that terminal using your user id and run the command top , netstat , free -m , on that terminal gnome , hope at a particular time you can able to check memory status .
As you might be aware that we can open multiple terminal at a time on Linux and can run command on that terminal hope this would help u out….
very good & helpful information sharing nice
very good post !!
I wonder what type 17 means here in this command : sudo dmidecode -t 17
why “17” ?
Thanks !!
17 mean the type o DMI that you want to analyse, in this case “Memory Device”,.
nice sharing would definitely recommend beginners to this article :)
How can I only get the free – buffers/cache numbers from free -m command?.
For example, this will display the buffers line: free -m | grep ‘buffers’. But I need only the “free” numbers
I know that you can use sed or awk to get the number, but I a don’t have enough experience with either to give a clear answer. You can however, use grep with awk to grab the correct column, as so:
root@notes# free -m
total used free shared buffers cached
Mem: 64395 13273 51122 691 274 1911
-/+ buffers/cache: 11087 53308
Swap: 32731 19 32712
root@notes# free -m | grep buffers/cache
-/+ buffers/cache: 10815 53580
root@notes# free -m | grep buffers/cache | awk ‘{print $4;}’
53296
I tell awk to grab the 4th column with “print $4” because the awk command will default to a blank space as the delimiter between columns. If you need to you can specific the column delimiter as well.
For more info on awk, check out https://www.digitalocean.com/community/tutorials/how-to-use-the-awk-language-to-manipulate-text-in-linux
Gud one!!
htop was just awesome, thank you
Very helpful! But I’d love more clarity on the gap between 2048 MB in the DIMM according to the last one (I’ll assume you actually have 4 of them, which properly totals 8192 MiB?), and the 8167848 kiB number in top, meminfo, , vmstat, and the 7976 MiB(?) number in free, htop, etc. I note that the dmesg command provides some more info to bridge that gap, e.g. on my system: [ 0.000000] Memory: 16096680K/16465712K available (7630K kernel code, 1131K rwdata, 3616K rodata, 1352K init, 1300K bss, 369032K reserved) vs top output of KiB Mem: 16126600.
Please correct the typo in “RAM Information” section. The command for viewing hardware info about RAM is “dmidecode” and not “demidecode”.
And it also requires root privileges.
Good article though. Thanks!
very helpful
Very helpful. Thank you.
seriously…. the last command was just awesome…. never seen anything like that.. .
Very Helpful, Thanks.